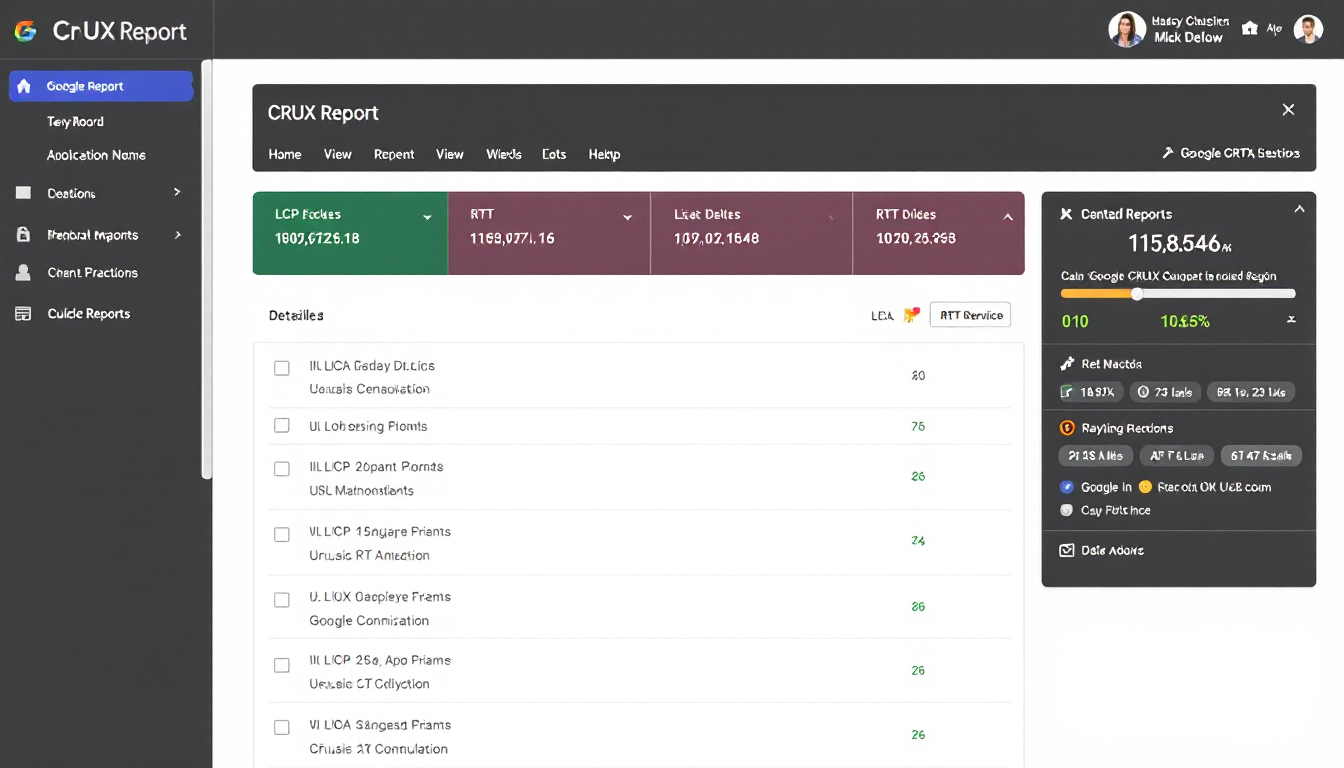
Google Chrome has rolled out the latest version of its Chrome User Experience Report (CrUX), providing deeper insights into page performance and network conditions.
DigitalOcean
DigitalOcean offers a variety of VPS hosting solutions perfectly suited for anyone seeking straightforward and budget-friendly computing power for their projects.
This update focuses on key metrics like Largest Contentful Paint (LCP) and Round Trip Time (RTT), offering valuable data to optimize website speed and improve user experience.
Key Enhancements in the CrUX Report
The new CrUX report delivers a more granular view of site performance, allowing developers and SEO specialists to identify and address specific issues affecting user experience and search rankings.
Detailed Largest Contentful Paint Metrics
Understanding the nuances of LCP is crucial for improving load times.
The update breaks down LCP into smaller components, making it easier to identify which parts of your page are causing delays.
The introduction of ‘image subparts’ enables pinpointing specific elements within the largest image, helping to identify whether server response times, rendering delays, or late image discovery are contributing to slower load times.
Enhanced Network Performance Insights
Accurate network performance data is essential for optimizing user experience across different regions and connection types.
By categorizing RTT into three distinct bins, the report provides a clearer picture of your audience’s network speeds. This allows for targeted optimizations, such as deploying content delivery networks (CDNs) or adjusting server locations to reduce latency for users in high-delay areas.
Additionally, the CrUX Vis tool has been updated to present detailed LCP subparts and country-specific RTT statistics, facilitating quick identification of performance bottlenecks across various regions.
Accessing and Utilizing the Updated Data
The latest CrUX update not only refines existing metrics but also expands the data available for analysis, providing SEO professionals with more tools to enhance website performance.
BigQuery Integration
Enhanced data accessibility through BigQuery allows for more comprehensive analysis and reporting.
With the new BigQuery datasets, users can access detailed RTT information alongside metrics like Interaction to Next Paint (INP), enabling a more thorough assessment of website performance across different parameters.
Improved Data Coverage
Wider data coverage means more accurate insights for a broader range of websites.
The removal of the Effective Connection Type (ECT) dimension allows Google to offer richer data across more sites, ensuring that even smaller or less trafficked websites can benefit from the detailed performance metrics provided in the CrUX report.
These enhancements empower SEO professionals to make data-driven decisions, optimizing their sites for better performance and higher visibility in search results.
The Bottom Line
Google’s latest update to the CrUX report equips website owners with more detailed insights into performance metrics like LCP and RTT.
By leveraging this information, you can effectively identify and address areas that hinder user experience and search visibility, ultimately enhancing your site’s performance and reach.


